ANALYSIS OF THE EUROPEAN GAS MARKET PRICES
Saint-Petersburg State University
Abstract
The article analyzes the causes of decline in energy prices in 2014 , as well as the impact of this situation on the European Union economy.
Keywords: energy, energy supply, EU, European Union.
Category: Economics
Article reference:
Analysis of the European gas market prices // Humanities scientific researches. 2016. № 9 [Electronic journal]. URL: https://human.snauka.ru/en/2016/09/16415
 View this article in Russian
 The international natural gas market is suffering from low prices since 2014, and it is important to see how it affected the world market and the situation in Europe. First, I will give an analysis of oil and gas prices and their impact on gas supply and demand. After that, I will try to see how the situation in Europe is and how we could overcome the political and economic pressure, what are our sources of gas deliver and the competitiveness of LNG on European market. Moreover, I am going to touch the American LNG and its pros and cons. In the final part, I will try to give predictions for Russian and Chinese gas markets to 2025.
Figure 1: Regional Gas Prices 2008-2015
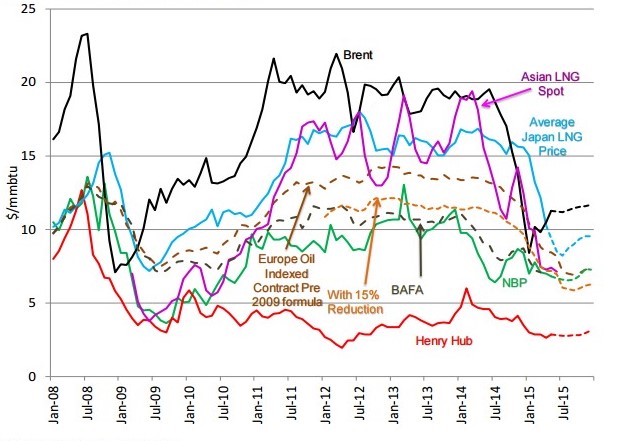
Source: The Oxford Institute for Energy Studies
The 2008 Financial crisis highly affected the demand of natural gas and oil that lead to crush in prices. What concerns natural gas, we have to separate regional reference prices that are linked to oil product prices and prices that depends on supply and demand.
For instance, the Fukushima disaster lead to increased demand of LNG and the prices reached the maximum in March 2013.
In contrast, Henry Hub prices depressed as a consequence of shale gas production continuing to outstrip demand growth.
In Europe, the link between oil and long-term gas contracts prices started decreasing by the end of 2014, as producers like Gas Terra and Statoil withdrew from the indexation of petroleum products in the direction of the hub indexing, as well as due to the fact that Gazprom has introduced price concessions and discounts .
As it has been broadly discovered throughout the media, oil prices were declining since summer 2014 because of the slow global demand and the rise of the US oil production, but after 27 November 2014, OPEC Meeting, prices dropped dramatically, with Brent falling to $66/bbl[1]. This immediately affected the gas prices that are associated to oil or oil product prices.
World natural gas consumption grew only by 0.4%[2]. Growth was below average in both the OECD and emerging economies: the EU (-11.6%), the Europe & Eurasia region (-4.8%). The total growth was due to such countries as the US (+2.9%), China (+8.6%) and Iran (+6.8%). EU production declined dramatically (-9.8%) to its lowest level since 1971. The US (+6.1%) recorded the world’s largest increase, accounting for 77% of net global growth.
Figure 2: European supply and demand in 2008-2014
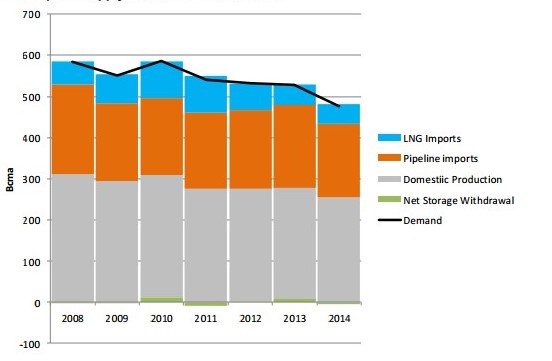
Sources: IEA Monthly Data Service
Since 2008, European gas demand has declined due to several reasons:
- Economic crisis and recession
- Replacement in power sector by coal (UK, Spain) and by renewables (Germany, UK, Spain and Italy)
According to Figure 2, in 2010 the European demand increased because of the cold winter and consequently declined in 2013-2014 as a cause of mild winter temperatures.
Yet, it is really difficult to predict the situation with EU demand and there are dozens of projections of future gas demand(Figure 3).
Figure 3:
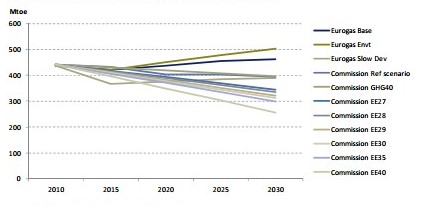
Source: European Commission, Eurogas, E3G
More than 50% of the European Union’s energy comes from countries outside the EU, and this proportion is growing as a whole over the past decade. Most of this energy comes from Russia, whose disputes with transit countries threatened to disrupt supplies in recent years. In November 2010, an initiative titled ‘Energy 2020 strategy for a competitive, sustainable and secure energy ” was adopted by the European Commission. This strategy defines the energy priorities for the period of 10 years and puts forward actions that could be taken in order to solve various problems, including achieving a market with competitive prices and security of supply, improving technological leadership, and effectively negotiate with international partners.
In addition, In order to continue the development and deployment of renewable energy technologies, the EU adopted the 2009 Renewable Energy Directive[3], which included a 20% renewable energy target by 2020 for the EU.
The ongoing construction of the Southern Gas Corridor will allow gas from Azerbaijan (reserves in the Caspian Sea) to achieve the EU Member States in 2020, providing an alternative source of energy. However, the initial projected volume of supply is only 10 billion cubic meters (compared to 160 billion cubic meters of Russian pipelines), so that the new pipeline will not have an impact on the European gas markets in the medium term.
Iran and Iraq are seemed to become potential suppliers but not for a short and medium term due to political reasons and Iran’s nuclear program.
Egypt is another traditional gas supplier to Europe, but it too is becoming an importer because of its growing domestic market – over the last 20 years, consumption has grown by 8 percent a year[4].
It is important to state, that the production in Europe will decrease as well, mostly in UK, Netherlands and Norway. It means that the EU will need more imports and as Europe does not want to depend on Russian gas, the demand, from my opinion, is likely to be provided by LNG. Today, of gas imports to the EU, 80-85% are delivered through pipelines, the remaining 15-20% in the form of LNG[5].
US LNG.
“LNG is changing the way gas is sold and priced in the world”, said Jason Bordoff, Director of the Center on Global Energy Policy at Columbia University in the US. “This is one of the fundamental stories in the global energy picture the next ten years and beyond.”[6]
LNG supplies to EU Member States arrive mainly from Qatar (currently the leading LNG exporter in the world), Algeria and Nigeria. More supply options are emerging as new countries invest heavily in LNG export capacity, particularly Australia, USA and Papua New Guinea.
Below, I will try to explain the competitiveness of US LNG and the impacts it will have in the recent future.
The United States is likely to become the main world exporter of LNG after Qatar and Australia because of the expanding resource base. Despite concern among producers in the United States that benefit from the huge number of low-cost, domestic natural gas as raw material, the country can absorb a huge share of the global LNG market. US industry has a huge advantage over competitors in Europe and North-East Asia.
The export of liquefied natural gas – or LNG – represents one of the most promising economic opportunities of the shale revolution. These exports will significantly reduce US trade deficit, increase government revenues, grow the economy, and support millions jobs in engineering, manufacturing, construction, and facility operations.
In time with such low energy prices, US LNG does not seem to be cheap enough to compete with other exporters. However, market opponents have their own difficulties that makes US LNG affordable.
For instance, Indonesia’s domestic demand doubled that means the decrease in export. In additions, the production of natural gas reduced in 2011-2013[7].
Norway’s amid proven reserves are falling for 20% since 2004 and production flat at 10.8 Bcf/day in recent years, and its output is projected as “shrinking.[8]“
Algeria’s export is declining year by year, due to the reason that domestic gas consumption has grown to 21% and is seemed to increase to 47% by the year of 2040[9].
The main competitor of the United States is Australia, which is ready to surpass Qatar as the largest LNG exporter in the world in terms of exports. Nevertheless, Australian projects face significant challenges because production costs is higher than expected, and labor costs have increased significantly. Because of this, coupled with the fact that the Australian LNG prices have been associated with the oil, it remains to be seen how competitive Australian LNG will be. Nevertheless, the potential for Australian exports is huge: “LNG exports rose in 2013 to 22.3 million tons (30.5 bcm), up 9% compared to 2012 and by 2018 the proportion of Australian gas is projected to increase to 81%.”[10]
We have seen that American LNG is likely to replace some leaders of this sphere, however, the question about the impact of US LNG on global market is really complicated as flows from the US will interact supply and demand forces of other countries and create the world market reaction. Still, the impact would be colossal. For example, the total output of US and Canadian projects is similar to Asia’s LNG demand. US massive LNG exports could push out higher cost gas along the supply chain, leading to a reduction in the marginal cost of gas supply into Asia.
Figure 4: The delivered cost of US LNG exports to Europe and Asia.
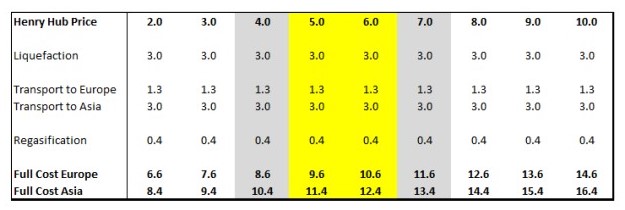
Source: Cheniere Energy data
From the Table 4 it is clear why the US exports are attractive to Europe. At a 2012 Henry Hub price ($2.83/mmbtu), the gas could come to Europe with the final price of $7.5/mmbtu in comparison with a spot price according to the UK NBP ($ 9.10/mmbtu)[11].
In contrast, natural gas prices in the United States are relatively low and are likely to increase, regardless of oil prices – the price of oil and natural gas in the United States are not connected. In short, the United States is only slightly competitive in the current LNG prices, and can not beat the lowest potential operating cost of Russia. The United States does not threaten the Russian market share in Europe. Yet, LNG will help to improve Europe’s leverage against Russia, providing an alternative source. In addition, it helps to create a ceiling price of LNG in dealing with Russia or other suppliers of natural gas. Over time, the growth of the North American LNG will enforce traditional partners for undercutting the prices of new sources of natural gas.
As we discussed above, there are already a plenty of alternatives for Russian gas including domestic production, renewables and LNG. However, as from my opinion, Russia remains the main exporter of gas to Europe.
The first reason is that domestic production of Europe is likely to continue to decline, mostly in Denmark and the Netherlands so that gas import will grow to 2030.
Second, we have LNG, but in 2014 LNG in Europe saw its low record as Asia increased its demand. Unfortunately, LNG is only at its starting point and have limited proposal. Therefore, until 2025, from my opinion, LNG will not cover the EU demand.
Lastly, the EU has a possibility to use a conventional gas, such as shale, but this one faces strong political opposition.
For medium term, as from my opinion, it is impossible to get rid of Russian gas, but it is important to search for more new partners, as most of the Russian gas contracts are likely to expire within the period to 2025.
What concerns Russian future plans, it is still not clear whether Russia will turn to Asian markets, especially to China, or will continue the dialogue with Europe.
China.
Two or three years ago, China’s energy demand growth seemed to be dramatically increasing until the year of 2025.
Figure 5: Chinese gas demand: IEA New Policies Scenario
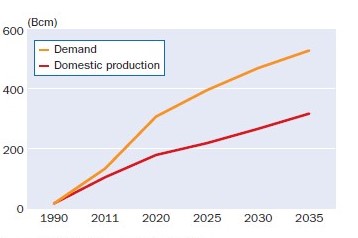
Source: IEA World Energy Outlook 2013
Now, government lowered its forecast from 400 billion cubic meters to 360 to the 2020[12].
One of the main factors slowing growth is the country’s transition from manufacturing to service-oriented economy. Output growth slowed to 6 percent in 2015, compared with 7.3 percent in 2014 and it was the slowest pace since 1999[13].
Consequently, this affected the amount of use of natural gas. The gas consumption of China grew up only for 3.7% for the first 11 month of 2015 in comparison to 5.6 % and 12.9% in 2014 and 2013 respectively[14].
The Chinese leaders consider natural gas as the preferred energy source. It has set an ambitious target to increase the share of natural gas in the energy mix to 10% in 2020[15][15].
As from my opinion, it would be impossible to reach this goal for mid-term; coal continues to occupy a major part of the energy mix, by 2020, natural gas will provide only 5% of consumption. The goal will be achievable after 2025.
One more reason for that is price. Reducing the demand for gas is also partly the result of state-regulated pricing. Despite the fall in prices in the world, Beijing delayed the reduction of domestic prices. When oil prices fell in the past year, natural gas in China lost their competitiveness in the oil. Coal is also a cheaper option in China.
In addition, China’s producers started to use wind turbines, solar panels, nuclear reactors that decreased the competitiveness of natural gas in market.
Overall, China is likely to continue reducing the consumption of coal, because the government is in favor of switching away from coal. Natural gas that is used in industry, power generation, heating and transportation, it is seemed to be an ideal candidate to change the country’s energy policy; gas is cleaner than coal and oil, and it can cope with power grids more easily than the unpredictable wind and sun.
To conclude with, it is important to mention that gas will continue to be one of the most important and used energy resources. Due to some economic and political problems, countries will search for new opportunities to deliver gas, looking for new partners, but also will try to implement renewables thus to decrease CO2 emissions. Nevertheless, until now, ecologically, natural gas is the cleanest existing fossil fuel.
[1] The Oxford Institute for Energy Studies, July 2015/ URL: https://www.oxfordenergy.org/wpcms/wp-content/uploads/2015/07/NG-99.pdf
[2]BP Statistical Review of World Energy, 2015/ URL: https://www.bp.com/content/dam/bp/pdf/energy-economics/statistical-review-2015/bp-statistical-review-of-world-energy-2015-full-report.pdf
[3] Directive 2009/28/EC of the European Parliament and of the Council of 23 April 2009 on the promotion of the use of energy from renewable sources and amending and subsequently repealing Directives 2001/77/EC and 2003/30/EC/ URL: http://www.ewea.org/fileadmin/ewea_documents/documents/publications/reports/EWEA_EU_Energy_Policy_to_2050.pdf
[4] Europe’s alternatives to Russian gas. European Council on foreign relations. April 2015/ URL:http://www.ecfr.eu/article/commentary_europes_alternatives_to_russian_gas311666
[5] Liquefied Natural Gas in Europe. Briefing. European Parliament, Nov 2015/ URL:http://www.europarl.europa.eu/RegData/etudes/BRIE/2015/571314/EPRS_BRI(2015)571314_EN.pdf
[6] URL: http://www.energypost.eu/gas-galore-europe-become-dumping-market-global-gas-supplies/
[7] Indonesian LNG under pressure as domestic gas demand grows. LNG World shipping. Oct 2015/URL: http://www.lngworldshipping.com/news/view,indonesian-lng-under-pressure-as-domestic-gas-demand-grows_39480.htm
[8] Shrinking Norwegian Natural Gas Production Puts Europe In Dire Situation. The Oil Price webpage, Nov 2015/ URL: http://oilprice.com/Energy/Natural-Gas/Shrinking-Norwegian-Natural-Gas-Production-Puts-Europe-In-Dire-Situation.html
[9] Pushing the Limits of Algeria’s Gas Exports to the European Union. Bulletin. The Polish Institute of International Affairs, July 2015/ URL: http://www.pism.pl/files/?id_plik=20133
[10] BG Group, “Global LNG Market Outlook 2014-15,” BG Group, http://www.bg-group.com/480/about-us/lng/global-lng-market-overview-2013-14/
[11] https://www.oxfordenergy.org/wpcms/wp-content/uploads/2012/10/NG-68.pdf
[12] China Gas Demand Forecast Cut by CNPC Researcher Amid Slowdown, Sep 2015/ URL:http://www.bloomberg.com/news/articles/2015-09-30/china-gas-demand-forecast-cut-by-cnpc-researcher-amid-slowdown
[13] China’s economy grew 6.9 percent in 2015, a 25-year low. CNBC, Jan 2016/ URL: http://www.cnbc.com/2016/01/18/china-reveals-key-q4-2015-gdp-data.html
[14]China’s 2015 Natural Gas Output Growth Slowest in At Least 10 Years. Downstream today, Jan 2016/ URL: http://www.downstreamtoday.com/news/article.aspx?a_id=50705&AspxAutoDetectCookieSupport=1
[15]China. Overview. EIA report, May 2015/ URL: https://www.eia.gov/beta/international/analysis.cfm?iso=CHN
References
- The Oxford Institute for Energy Studies, July 2015/ URL: https://www.oxfordenergy.org/wpcms/wp-content/uploads/2015/07/NG-99.pdf
- BP Statistical Review of World Energy, 2015/ URL: https://www.bp.com/content/dam/bp/pdf/energy-economics/statistical-review-2015/bp-statistical-review-of-world-energy-2015-full-report.pdf
- Directive 2009/28/EC of the European Parliament and of the Council of 23 April 2009 on the promotion of the use of energy from renewable sources and amending and subsequently repealing Directives 2001/77/EC and 2003/30/EC/ URL: http://www.ewea.org/fileadmin/ewea_documents/documents/publications/reports/EWEA_EU_Energy_Policy_to_2050.pdf
- Europe’s alternatives to Russian gas. European Council on foreign relations. April 2015/ URL:http://www.ecfr.eu/article/commentary_europes_alternatives_to_russian_gas311666
- Liquefied Natural Gas in Europe. Briefing. European Parliament, Nov 2015/ URL:http://www.europarl.europa.eu/RegData/etudes/BRIE/2015/571314/EPRS_BRI(2015)571314_EN.pd
- URL: http://www.energypost.eu/gas-galore-europe-become-dumping-market-global-gas-supplies/
- Indonesian LNG under pressure as domestic gas demand grows. LNG World shipping. Oct 2015/URL: http://www.lngworldshipping.com/news/view,indonesian-lng-under-pressure-as-domestic-gas-demand-grows_39480.htm
- Shrinking Norwegian Natural Gas Production Puts Europe In Dire Situation. The Oil Price webpage, Nov 2015/ URL: http://oilprice.com/Energy/Natural-Gas/Shrinking-Norwegian-Natural-Gas-Production-Puts-Europe-In-Dire-Situation.html
- Pushing the Limits of Algeria’s Gas Exports to the European Union. Bulletin. The Polish Institute of International Affairs, July 2015/ URL: http://www.pism.pl/files/?id_plik=20133
- BG Group, “Global LNG Market Outlook 2014-15,” BG Group, http://www.bg-group.com/480/about-us/lng/global-lng-market-overview-2013-14/
- https://www.oxfordenergy.org/wpcms/wp-content/uploads/2012/10/NG-68.pdf
- China Gas Demand Forecast Cut by CNPC Researcher Amid Slowdown, Sep 2015/ URL:http://www.bloomberg.com/news/articles/2015-09-30/china-gas-demand-forecast-cut-by-cnpc-researcher-amid-slowdown
- China's economy grew 6.9 percent in 2015, a 25-year low. CNBC, Jan 2016/ URL: http://www.cnbc.com/2016/01/18/china-reveals-key-q4-2015-gdp-data.html
- China's 2015 Natural Gas Output Growth Slowest in At Least 10 Years. Downstream today, Jan 2016/ URL: http://www.downstreamtoday.com/news/article.aspx?a_id=50705&AspxAutoDetectCookieSupport=1
- China. Overview. EIA report, May 2015/ URL: https://www.eia.gov/beta/international/analysis.cfm?iso=CHN
All articles of author «Юсупова Гульнара Рафиковна»
© If you have found a violation of copyrights please notify us immediately by e-mail.