Российский экономический университет им. Г. В. Плеханова
студент-магистр
FEATURE ASSESSMENT METHODOLOGIES IN IT START-UPS
Plekhanov Russian University of Economics
master student
Abstract
IT start-ups try to address key needs of users when developing products. It is not always clear which feature to make first. The paper addresses a range of feature assessment methodologies, peculiarities of them with examples. The techniques are divided into two parts – fast and more detailed. A manager can get familiar with them and can chose between the two or combine both in the work process.
Keywords: Agile, backlog, backlog grooming, feature, feature prioritization, product management, project management
Рубрика: Экономика
Библиографическая ссылка на статью:
Маловацкая А.О. Feature assessment methodologies in IT start-ups // Гуманитарные научные исследования. 2022. № 6 [Электронный ресурс]. URL: https://human.snauka.ru/2022/06/50509 (дата обращения: 01.08.2026).
Introduction and problem statement
IT start-ups try to be agile to quickly address the demand. The resources are limited thus prioritization plays a crucial role. In the development of IT products prioritization can be analyzed in terms of features. Features are increments of products which bring added value. Each feature can be evaluated on such parameters as reach, effectiveness, confidence, costs and others. There is a number of features assessment techniques. These methods can be divided into two categories: fast and more detailed assessment. This paper coves both of them, including scoring and RICE methodologies.
Nowadays Russian IT companies try to cover the demand in the software market. There is a need of proper internal processes to optimize workflow, including feature prioritization.
The problem is that small IT companies are only starting their way and are not familiar with a wide range of methodologies they could use. The implementation of them could save resources to stay competitive on the market. The paper covers a list of methods to be taken into account.
In order to provide a deeper research, the method of data illustration was used to give visual references. Moreover, comparison is among the techniques that provide a parallel analysis of the matters discussed. The research is based on the scientific articles and internet resources.
Prioritization of features
IT product feature is part of a product which has specific characteristics. A product can be improved gradually feature by feature. It allows the processes in the team stay agile. Managers try to break bigger tasks into smaller ones to decrease time-to-market. Such approach allows develop, test and pivot faster answering the needs of the market. A feature can have wide or narrow range of user segments. Whatever the size of the user segment, a feature should have a positive user experience (UX) to improve sure key metrics of the product.
The life of a feature can be divided into following steps.
-
Analysis of needs in the market. This step can include the collection of primary and secondary data. A manager can conduct interviews, surveys, A/B testing, benchmarking and other types of data collection. Moreover, after the collection of data there is analysis of it. This step allows a manager to obtain proof of need and potential return on investment.
-
Formulation of a feature. A manager should add a feature to a list of backlog with the results of the analysis. When a backlog meeting takes place a whole team will review the idea and evaluate such aspects as need, resources needed to accomplish it, the return.
-
Prioritization of a feature. This step is based on the value the feature can bring, how urgent it is to develop it and the costs of developing it. In order to make a decision representatives of several departments asses it.
-
The development of a feature. Feature by feature are taken into the development process. When time comes for a specific feature, the development team is assigned to bring it into life.
-
Evaluation of results. When the feature is brought to the end users there is a period of time when the results are collected. After this time there can be seen the value which the feature brought. Based on these results a manager can assess the process and come up with improvements of the process and upcoming features.
Apart from these steps there can be others more detailed as well. For example, a team can decide that a proposed feature can be divided into several smaller features. The implementation of each of them separately does not have a negative impact on the end-user. Moreover, not all smaller features can be accepted right away. A team may decide to develop only a main part of an initial feature to test the general idea. And only after testing there can be added details as new features.
There are various needs in the market and start-ups try to address them coming up with a big number of features to develop. However, the resources of start-ups are limited and not all needs are urgent and crucial. Thus, companies should prioritize those features to have a balance between the demand and supply.
The classification of prioritization methods can be illustrated by the figure 1.
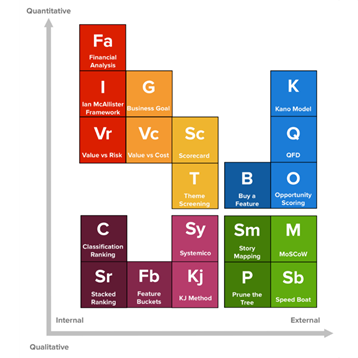
Figure 1 – the graph of feature prioritization methods.
On the horizonal axes there are internal methods of feature prioritization. These methods require team of a company to decide. If external parties are involved, for example, users, then these methods are external.
On the vertical axis there is a difference between the data to make a decision. The data can be either quantitative or qualitative. Quantitative data is connected with the amount of a specific parameter. Qualitative data is connected with the conditional level of parameter (deep interviews with users).
External methods are used when the product is new to the market. It is still not clear what are the deep needs of users.
Internal methods are useful when there are metrics in the product which allow a team to make decisions based on them.
During a backlog meeting a team has a limited period of time to assess proposed features. That is why for this stage a team can use faster methods of decision making. After the backlog meeting a manager can add one more level of evaluation to add a prioritization score to a feature.
As it can be seen, there exist a number of methodologies with their peculiarities. Russian IT start-ups can improve their prioritization processes by implementing proper feature assessment methodologies.
Fast feature prioritization methods
Main fast prioritization methods include:
-
Reach/Frequency method;
-
Poker planning;
-
Scoring;
-
Eisenhower Matrix.
A method of Reach/Frequency contains two parameters:
-
Reach – how many people will potentially use a feature;
-
Frequency – how often those people will potentially use a feature.
The following matrix can illustrate the method.
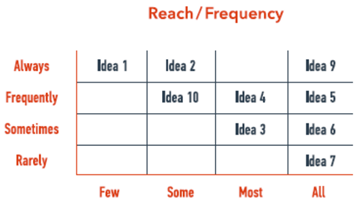
Table 1 – Reach/Frequency method matrix.
This methos is internal and can allow a team to get rid of features with low reach and low frequency. The features that will stay in the list for development are potentially the most frequent in use reaching the majority of end-users.
The next is Poker planning method or the method or benefits to costs.
The table consists of three columns:
-
Average usefulness rating – to which degree a feature is crucial for users;
-
Average cost rating – an approximate evaluation of development costs, how many resources are needed.
Each team member votes on each parameter from 1 to 3. Then a manager writes down an average from the scores of the team. In the last column there is a calculation of a benefit to a cost, the column average usefulness rating is divided by the column average cost rating. Each feature is assessed this way.
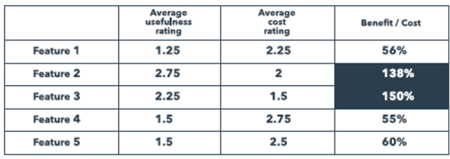
Table 2 – an example of a Poker planning table. Source: the same is for previous table.
Then a manager chooses 2-3 features with the highest benefit to cost index.
Another method of fast evaluation is Scoring. This method consists of two steps.
For the first step each member of the team votes on each feature. Each team member has number of votes equal to the number of features in the list. Top 2-3 features proceed to the next level.
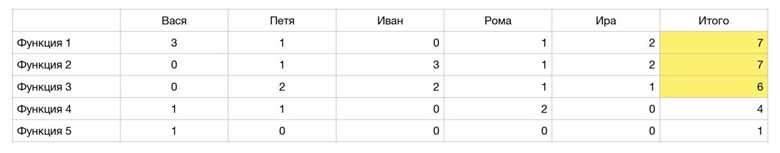
Figure 2 – Scoring step 1.
The next level is more detailed. Top 2-3 features from the previous step are evaluated. Now assessment is done on each parameter of a feature. In the example below average value consists of the scores for the reach, conversion and revenue. After that the column development is evaluated on the matter of how many resources needed to make a feature. The final score is the division of the resources needed (costs) to the average value (benefits).
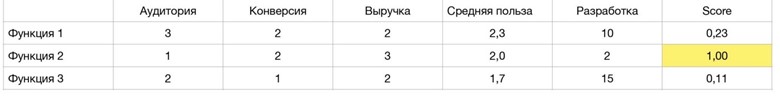
Figure 3 – Scoring step 2.
The feature with the highest score is chosen to be developed first. Scoring method is useful when the list of backlog is not long.
The last fast assessment method in this paper is Eisenhower Matrix.
The Eisenhower Matrix is the method of the American President Dwight D. Eisenhower, based on the assessment of tasks according to the criteria important / not important and urgent / not urgent.
This method represents tasks in the form of an Eisenhower Decision Matrix (or simply “Eisenhower Matrix”). The horizontal x-axis shows urgency, from most urgent on the left to least urgent on the right. The vertical y-axis shows the degree of importance, from least important at the bottom to most important at the top.
The result is four sectors: urgent and important; less urgent but important; less important but urgent; less important and less urgent. A manager can divide all features into these sectors to get a clear idea of what needs to be done now, and what can (and should) be postponed until later.
After the backlog meeting a manger can dedicate time to a more detailed assessment of prioritization. There are several methods for this task.
Detailed feature prioritization methods
RICE method is developed by Intercom company. There are four parameters to assess: reach, impact, confidence and effort.
Reach is measured in number of people/events per time period. That might be “customers per quarter” or “transactions per month”. As much as possible, use real measurements from product metrics.
Example: every customer who uses this feature each quarter will see this change. The reach is 2,000 customers per quarter.
Impact is difficult to measure precisely. So, a manager can choose from a multiple-choice scale: 3 for “massive impact”, 2 for “high”, 1 for “medium”, 0.5 for “low”, and finally 0.25 for “minimal”. These numbers get multiplied into the final score to scale it up or down.
Example: for each customer who sees it, this will have a huge impact. The impact score is 3.
Confidence is a percentage, and a manager can use another multiple-choice scale to help avoid decision paralysis. 100% is “high confidence”, 80% is “medium”, 50% is “low”. Anything below that is “total moonshot”.
Example: a manager has data to support the reach and effort, but he or she is unsure about the impact. This project gets an 80% confidence score.
Effort is estimated as a number of “person-months” – the work that one team member can do in a month. There are many unknowns here, so a manager can keep estimates rough by sticking to whole numbers (or 0.5 for anything well under a month). Unlike the other positive factors, more effort is a bad thing, so it divides the total impact.
Example: a feature will take about a week of planning, 1-2 weeks of design, and 2-4 weeks of engineering time. A manager can give it an effort score of 2 person-months.
The formula for calculating RICE is the following:
RICE = (Reach * Impact * Confidence) / Effort
RICE can help immensely when deciding between hard-to-compare ideas.
Hierarchy of metrics is the next method. A manager can follow an algorithm:
-
Global − The top-level metric that is defined by the company. Indicates the frequency of user interactions with different features: how often they return, how many actions they perform while using the service.
-
Service − Basic service metric: start from this stage and define service metrics that directly affect the upper level metric.
-
Level 1. Determine the factors that affect the service metric.
-
Level 2. Dig deeper into each of the identified metrics — look for deeper factors (LVL 2 metrics) that affect LVL 1 metrics.
-
Other. Next, continue to dig deeper until you identify all the underlying / fundamental factors.
-
Do the same with all the metrics.
-
Next, formulate a hypothesis or select a feature that you want to implement, and ask yourself an important question: what metric will this feature affect?
-
Determine the level at which the identified metric is located.
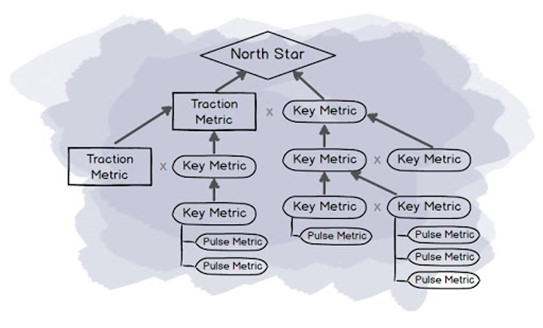
Figure 4 – Hierarchy of matrix.
The point of this method is to assess how close or far away the hypothesis / feature is to the main (global) service metric. The closer the metric in the hierarchy to the main one, the more likely it is that the related feature will be useful. If the feature is buried far away from the main service under many layers, the feature is less likely to influence the main metrics.
Based on the metrics, a manager should create a table with features and prioritize them. Highlight 2−5 of the most important metrics of the service (Column − “Metrics”). Each of combinations of “metric − metric level 1″ has an impact on the main metric of the service. Evaluate what type of growth indicator (as a percent) you want to receive using these metrics: N% growth for the quarter. Formulate a list of projects that we be started to influence a specific metric. For each of feature (inside the corresponding metric) determine the weight, or importance (from 1 to 3). A manager can start by using the mechanics of Poker Planning. Select the features that have the highest weight.
By using this system, a manager gets a methodology for two-stage prioritization: first, by focusing on key metrics, the first stage focuses only on the most important ones and discard lower priority functions of the product.
Then, at the second stage, a manager prioritizes within each key metric.
The last method in this paper is the assessment of features based on ROI. This method can be illustrated on the example.
There is a number of users per year. A manager makes a forecast that 70% of users will use the product, and 50% of users will purchase the product. There is an estimation that the implementation of the feature will bring the company 4% of the profit. Knowing how much profit the company will have from one payment, there is the amount that the feature will bring in an additional year.
Then the developers estimate how long the development will take. A manager calculates get the cost of development.
With this data, a manager calculates the ROI ((income – expenses) / expenses * 100%) of the feature. This steps are implemented to each feature in the list to compare ROI. The higher the return the better.
A manager can also make a more detailed study of the table with the base % conversion, pessimistic and optimistic scenarios.
Conclusions and recommendations
Today, a feature is any characteristic of a product that has specific features. These can be mechanisms that add new functionality, elements that turn the product into a unique one. This word is most common in the gaming industry, in the field of software, website development.
The paper covered two groups of feature assessment methods: fast and detailed ones. Fast methods included Reach/Frequency method, Poker planning, Scoring and Eisenhower Matrix. More detailed methods include RICE and Hierarchy of metrics.
A manager in a start-up should choose one technique from a fast assessment group and one from a detailed assessment group. Two methodologies should be implemented one by one. First during the backlog meeting with a team, second with only a couple of team leads to evaluate more precise.
Overall, with the mixed assessment a team will contribute to the decision and will not lose time on the detailed evaluation as the manager will do it separately. Additional evaluation will give a better perspective on the features in connection with internal and external factors.
References
- Federal Law No. 127-FZ of August 23, 1996 (as amended on April 16, 2022) "On Science and State Science and Technology Policy"
- Agilemanifesto.org. 2022. Manifesto for Agile Software Development. [online] Available at: <https://agilemanifesto.org/> [Accessed 29 April 2022].
-
Agile Arena. 2022. What is Scrum?. [online] Available at: <https://www.agilearena.net/what-is-scrum/> [Accessed 10 April 2022].
- codernet.ru 2022. Not a bug, but a feature. What does this mean and where did this phrase come from? [online] Available at: <https://codernet.ru/articles/drugoe/ne_bag_a_ficha_chto_eto_znachit_i_otkuda_poyavilas_eta_fraza/> [Accessed 23 May 2022].
- Geraghty, L., McGlinchey, A., McGlinchey, A., Murphy, A., Smrekar, A., Traynor, D., Niechciał, K., Chaudhari, P. and McBride, S., 2022. RICE: Simple prioritization for product managers. [online] Inside Intercom. Available at: <https://www.intercom.com/blog/rice-simple-prioritization-for-product-managers/> [Accessed 28 May 2022].
- Habr. 2022. Feature prioritization. [online] Available at: <https://habr.com/ru/post/523862/> [Accessed 27 May 2022].
- Medium. 2022. Prioritization methods. [online] Available at: <https://medium.com/mytake/prioritization-methods-af816003a49d> [Accessed 24 May 2022].
Все статьи автора «Маловацкая Алина Олеговна»
© Если вы обнаружили нарушение авторских или смежных прав, пожалуйста, незамедлительно сообщите нам об этом по электронной почте.